GEX and DEX, explained. In plain English.
EasyBear.ai maps live dealer positioning in SPX, SPY and QQQ, so you can see where hedging flows will dampen or accelerate price. This tutorial teaches you how to read the map.
Last updated: 21 September 2026 (10:25 ET)
A. The basics
The vocabulary you need before any level on the dashboard makes sense.
Never traded options? Sixty seconds of background.
If you already know delta and gamma, skip ahead to A1. Otherwise, this box is the whole vocabulary this tutorial assumes.
| Term | What it measures | Why you care |
|---|---|---|
| Option | The right to buy or sell 100 shares at a set price by a set date | The building block; every metric below is a way to measure how it moves |
| Delta | How much the option's price moves per $1 stock move | Effectively, how many shares the option acts like right now |
| Gamma | How much delta itself changes per $1 stock move | How fast the option's exposure re-marks as spot drifts |
- Option
- A contract that gives you the right to buy or sell 100 shares of stock at a chosen price by a chosen date. You pay a small fraction of the stock's cost for that right, in exchange for a fixed expiry.
- Delta
- How much the option's price moves per $1 the stock moves. A 0.50-delta call gains $0.50 per $1 rally. Also the number of shares you're effectively long while you hold the option.
- Gamma
- How much delta itself changes per $1 move. A 0.02-gamma option's delta rises by 0.02 for every $1 rally. Gamma is what makes dealer hedging mechanical, which is what this whole tutorial is about.
What is gamma exposure (GEX)?
- GEX is the dollar amount dealers must trade per 1% move in the underlying.
- Positive GEX: dealers sell rallies and buy dips. Ranges tighten.
- Negative GEX: dealers trade with the move. Ranges expand, gaps happen.
- The sign tells you the regime. The strikes tell you where flows concentrate.
So let's take this apart. Gamma exposure is the dollar amount of stock or futures that dealers must trade to stay hedged when the underlying moves 1%. Real dollars, live from the options chain, refreshed every 15 minutes.
Here's the trap this saves you from. Say it's 3:40pm ET on 2 Jul 2026 and SPX has pressed into 7,500 three times. Every push stalls. If you're short that stall you feel like a genius. If you're long the breakout you feel picked on. Both takes are wrong for the same reason. On the /gex dashboard, 7,500 shows +$4.4B of gamma exposure. Translation: dealers holding those calls must sell about $4.4B of SPX futures for every 1% SPX rallies into that strike. Every push walks them into the same forced sell. That is not luck. It's a wall you can measure.
Stay with me, this next bit is the whole game. Positive GEX makes dealers act like brakes. They sell rallies, buy dips, and the day chops. Negative GEX makes them act like an accelerator. Small moves grow into big moves, and gaps happen.
Who are these "dealers" and why do they move the market?
- Dealers are the market makers on the other side of every options trade.
- Their job is quoting, not directional trading, so they hedge every position.
- Hedging = buying or selling the underlying to stay flat as price moves.
- The hedging is mechanical, which is why it shows up as measurable structure.
Dealers are the market makers on the other side of every options trade. Big banks and specialist firms. Their job is quoting bids and offers, not directional trading, so they hedge every position that lands in inventory to stay flat.
Let's walk the loop. You buy one SPX call from a dealer. The dealer is now short that call, which means the dealer is short delta on the way up. To be flat, the dealer buys some SPX futures. When SPX rallies, the dealer's short-call loss grows faster than the futures gain, because gamma. So the dealer buys more futures. When SPX drops, the dealer sells the futures back. Constant re-hedging. Gamma controls how much re-hedging is required per 1% move.
Here's a small worked number so this stops feeling abstract.
1,000 SPX calls
x 0.02 gamma            (delta change per $1 move)
x 74.83 points          (a 1% SPX move)
x 100                   (contract multiplier)
= about $150M           (forced dealer buying per 1% rally)
Multiply that loop by every position in dealer inventory across every strike and every expiry, and you get GEX. That's the whole model, and it's why the number lives on the dashboard in real dollars, not vibes.
What is DEX and how is it different from GEX?
- DEX is the dollar amount of stock dealers must currently hold to be flat.
- GEX is what they must trade tomorrow if price moves 1%.
- DEX is standing weight. GEX is the change to that weight per 1% move.
- GEX is the regime, DEX is the lean.
OK, GEX told us what forced trading happens per 1% move. DEX tells us the standing weight dealers already carry today.
Delta exposure is the dollar amount of underlying dealers must currently hold to be flat. Not the change per 1% move, the current position. If dealers are short 50,000 puts at 7,400 SPX, they carry a lot of positive DEX at that strike, because shorting puts is bullish exposure they have to offset by shorting stock or futures.
Think of the book as a see-saw. DEX tells you which side is heavier right now. On 2 Jul 2026, SPX DEX is call-tilted overhead of 7,483 spot. Meaning dealer inventory leans long stock in the strikes above spot. If price rallies into those strikes, dealers already own the exposure, so re-hedging pressure is lighter above than a naive open-interest read would suggest.
GEX is what happens when the see-saw tips. Positive GEX pushes back on any tilt; negative GEX runs with it. GEX is the regime, DEX is the lean.
What's the "ball and bowl" thing?
- Positive gamma is a bowl. Any push comes back to the middle.
- Negative gamma is a hill. Any push accelerates.
- The gamma flip is a bowl balanced on a hill. Above it, chop. Below it, trend.
- The dashboard's profile curve draws exactly this shape.
Positive gamma is a bowl. Negative gamma is a hill. Price is a marble. Stay with me on this, it's the picture that will make every other section click.
Roll a marble around inside a bowl. It settles toward the bottom. Anywhere you push it, gravity brings it back. That's positive GEX. Dealers dampen. Ranges tighten. Big moves fade before they finish.
Now roll the same marble down a hill. Any push accelerates. It runs. That's negative GEX. Dealers amplify. Small moves become big moves. Gaps happen.
Now imagine a bowl balanced on top of a hill. Above a specific price, gravity pulls the marble in. Below that price, gravity throws it out. That flip point is the gamma flip level. On 21 Sep 2026 (10:25 ET), SPX's flip sits at 7,655. Above it, the day feels like a bowl. Below it, it feels like a hill. Same book, two personalities, one line between them.
Is this a signal service? Will it tell me when to buy?
- No. EasyBear.ai maps structure. It does not tell you what to trade.
- Dealer hedging is arithmetic. The map shows what forced flows will do.
- The edge is knowing the field, not being handed a play.
- Every number on /gex is traceable to a mechanism, stated plainly.
No. EasyBear.ai maps structure. It does not tell you what to trade. Let's talk about why that's the honest answer, not the humble one.
Predicting price is a losing game against everyone else trying to do the same thing. Mapping structure is not. The gamma structure sits there in dealer hedging obligations, denominated in real dollars per 1% move, refreshed every 15 minutes from the live options chain. That map does not tell you what will happen. It tells you what dealers will have to do if it does.
When SPX taps the call wall, the dealers holding those calls must sell futures. That is not a prediction. That is arithmetic. What you do with that knowledge is your call.
The edge here is knowing the field, not being handed a play. Traders who read structure well take fewer trades with more conviction, because they know why a level should hold before it does, and they know what would break the thesis before they enter.
| What EasyBear.ai is | What EasyBear.ai is not |
|---|---|
| A live map of dealer hedging obligations in real dollars per 1% move | A signal service telling you when to buy or sell |
| Arithmetic anyone with an options chain could reproduce | A directional prediction engine |
| Refreshed every 15 minutes during market hours | A stream of alerts |
| Explicit about what is measured, modeled, and not knowable | Willing to fake the third category |
B. Reading the numbers
Six questions about the headline numbers you see on load.
GEX is +$4.9B. Is that a lot? What is high, what is low?
- Net GEX is the headline dollar figure; gross GEX is the total absolute weight in the book.
- Honest answer: we don't publish per-ticker typical ranges until our own tracked snapshot history has a denominator behind them.
- Two checks ARE knowable today: the offset ratio (net divided by gross), and Peak Gamma concentration.
- Together they turn the headline dollar figure into a read of whether the label or the levels are doing the work.
Honest answer: not yet. The "is that a lot" question wants a percentile ("this GEX is bigger than 80% of recent sessions") and we can't publish one until our snapshot history has a denominator behind it. R2 baseline: no invented ranges here.
What IS knowable today are the dated live values on the dashboard and two structural checks you can run on them.
Check 1 is the offset ratio: absolute net divided by gross. A low ratio means the regime label is doing little of the work; the book has large positive and negative pockets that cancel out. A high ratio means net positioning genuinely dominates the book. As of the 21 Sep 2026 snapshot (10:25 ET), SPX shows +$53.3B net against $129.3B gross, ratio about 0.41. Read the levels; the ratio tells you how much weight to put on the headline versus the strikes themselves.
Check 2 is concentration. The Peak Gamma card shows what percentage of net dealer gamma sits at the dominant expiry. Above 40% is a heavy pin-risk read into that expiry's date; below 20% is a distributed book. When the dominant expiry aligns with monthly OPEX, pin risk is at its highest.
We publish typical ranges once our own tracked history is deep enough to state them with a denominator, and not before.
| Check | What it tells you | Threshold |
|---|---|---|
| Offset ratio (net ÷ gross) | How much of the book's weight is net-directional | Near 0 = label decorative; near 1 = label truthful |
| Peak Gamma concentration | Whether a single expiry dominates today's book | Above 40% = heavy pin risk; below 20% = distributed |
net GEX / gross GEX = offset ratio (how much of the book cancels itself out; near 1 means little offset, near 0 means the label is doing all the work)
Positive vs negative GEX. What actually happens to price?
- Positive GEX pulls price back toward its recent range. Chop and drift.
- Negative GEX pushes price further out. Trend and gap.
- Above-flip positive leans supportive; below-flip negative leans heavy.
- Lean is not a signal; real news breaks any regime any day.
Positive GEX pulls price back toward its recent range. Negative GEX pushes it further out. That's the whole day-to-day read in one sentence.
Under positive GEX, rallies get sold and dips get bought, because dealers hedging their long-gamma book must trade against the move to stay flat. Ranges compress. Big candles reverse. Overnight gaps often fade at the open. It's the market's most boring regime, and its most fadeable.
Under negative GEX, dealers hedge in the same direction as the move, so trends continue. Small moves become big moves. Volatility expands. A morning gap that would fade in long gamma extends in short gamma. This is where a gamma squeeze lives: a sharp move up forces dealers to buy more, which pushes price higher, which forces more buying. It's not a magic event. It's one regime's mechanics doing exactly what they're defined to do.
One line of orientation for beginners, then Category E owns the trading detail. A positive-GEX book with spot above the flip line leans supportive. A negative-GEX book with spot below the flip line leans heavy. That's a lean, not a signal, and real news can break it at any time.
What does "Long Gamma · Offsetting" mean? Net vs gross?
- Net GEX = positive minus negative pockets. Gross GEX = their absolute sum.
- High offsetting = positive and negative pockets largely cancel each other out.
- In offsetting states, the level read beats the headline read.
- Neutral is the third state: net near zero, small book, quiet drift.
Long Gamma · Offsetting means net GEX is positive, but positive and negative pockets in the book largely cancel out. On 21 Sep 2026 (10:25 ET), SPX shows +$53.3B net against $129.3B gross. The net says positive, the gross says the book is enormous, and the ratio says most of the weight offsets.
When offsetting is high, the headline label is honest but misleading if you use it alone. The book is not evenly positive-gamma. It's a mix that happens to sum positive. In that state, read the levels, not the headline. The call wall and put wall matter more than the net number.
You'll also see these regime labels on the card:
Short Gamma · Offsetting   (net negative, gross large, most of the book cancels)
Neutral                    (net roughly zero, book is small, quiet drift and low conviction)
Regime Transition          (spot is right at the flip line; volatility can pick up either way)
| What the net says | What the gross says | What to trust |
|---|---|---|
| +$4.8B (positive lean) | $66B (huge book) | Ratio 0.07 → the levels, not the headline |
| -$2.0B (negative lean) | $3B (small book) | Ratio 0.67 → the headline is largely truthful |
| $0B (Neutral) | any | The label is telling you it has nothing; look at the walls |
Why per 1% move? What do the units mean?
- GEX is in dollars of underlying dealers must trade per 1% move in price.
- DEX is in dollars of underlying they must currently hold to be flat.
- Both are computed per strike from live open interest and greeks.
- The units let you compare exposures across strikes and tickers on one scale.
GEX is denominated in dollars of stock or futures that dealers must trade per 1% move in the underlying. So +$4.4B at 7,500 means: if SPX rallies 1% into 7,500, dealers hedging their positions at that strike must sell about $4.4B of SPX futures to stay flat.
The math is direct. Here's the formula and a worked example.
gamma
x open interest
x 100                   (contract multiplier)
x spot
x 1%                    (the priced move)
= GEX per strike        (dollars dealers must trade per 1% move at that strike)
Plug it in. Suppose dealers are net short 100,000 SPX calls at 7,500 with a per-contract gamma of 0.005, and SPX spot is 7,483. A 1% move is 74.83 index points. Their combined delta shifts by:
100,000                 (net short SPX calls at 7,500)
x 0.005                 (gamma per contract)
x 74.83 points          (a 1% SPX move)
x 100                   (contract multiplier)
= about $37.4M          (per-contract-group per 1% move)
Sum that across all strikes and all expiries, and you get the GEX headline you see on the dashboard. DEX uses the same idea, but for delta itself, not delta change. DEX at a strike is dollars of underlying dealers currently hold to be flat, given the options they carry.
| Spot | Same positioning (illustrative) | Dollars per 1% move |
|---|---|---|
| 4,000 | 100k calls, gamma 0.005 | about $20M |
| 6,000 | 100k calls, gamma 0.005 | about $30M |
| 7,500 | 100k calls, gamma 0.005 | about $37.5M |
High DEX at a strike. What does it tell me?
- High DEX at a strike = dealers carry significant standing weight there.
- Call-tilted DEX above spot suggests dealers own the strikes overhead.
- Put-tilted DEX below spot suggests dealers hedge shorts down there.
- The GEX x DEX 2x2 gives you a compact resistance / support read.
High DEX at a strike means dealers must currently hold a lot of stock or futures against options concentrated there. Not gamma; standing weight. A strike with 100,000 puts held short by dealers has heavy negative DEX at that strike whether or not price moves.
Position matters. Call-tilted DEX above spot suggests dealers are short calls up there, which they hedge by owning underlying. Put-tilted DEX below spot suggests dealers are short puts down there, hedged by shorting underlying.
Here's the 2x2 quick read you'll use every day:
| GEX | DEX | Structural read |
|---|---|---|
| Positive | Call-tilted overhead | Strongest resistance in the book |
| Positive | Put-tilted below | Strongest support in the book |
| Negative | Call-tilted overhead | Fragile setup; dealers buy into rallies |
| Negative | Put-tilted below | Classic acceleration setup on a break |
That grid is why the /gex dashboard shows GEX and DEX side by side in the GEX vs DEX view. Reading them apart is guessing at half the picture.
Why doesn't EasyBear.ai say "whales" or "institutional flow"?
- Trade-side attribution needs data the feed doesn't tell anyone.
- Without last-trade tape and aggressor flags, "whale" labels are a guess.
- EasyBear.ai only shows what is knowable from open interest, greeks, and price.
- Dealer positioning is inferred from the industry-standard sign convention, stated plainly.
Because trade-side attribution needs data the feed doesn't tell anyone at a normal price. To know whether a print hit the ask or the bid, you'd need last-trade tape with aggressor flags. Even with it, the flag only tells you which side crossed the spread. It never tells you who traded. Naming a print as "whale buying" without that data is guessing dressed up as fact.
The honesty moat: EasyBear.ai shows only what is knowable from open interest, greeks, and price. Dealer positioning is inferred from the industry-standard sign convention (dealers long calls, short puts against the public). That inference sits on the footer TRANSPARENCY row in plain sight. Aggressor, sweep, and institutional labels are refused by design, not by omission.
Two consequences of doing it this way. First: EasyBear.ai's numbers can be verified by any options trader with a chain of their own. Nothing hides behind vendor magic. Second: when another service claims aggressor context they cannot know, that is not a feature. It is a lie of confidence, and the difference between our number and theirs is the confidence, not the data.
| We show | We don't show | Because |
|---|---|---|
| Dealer positioning inferred from open interest and greeks | Trade-side attribution (whale / sweep / institutional) | The feed carries no last-trade tape, so a "who did that" label is a guess |
| GEX and DEX in real dollars per 1% move | Direction predictions | Structure and prediction are different jobs |
| Coverage stats and the sign convention on the footer | Vendor-magic labels | You should be able to reproduce every number from your own chain |
C. Levels that matter
Walls, the flip, shelves, peaks and the Book Anchor: where hedging flow concentrates and how to read the seven-question map.
What is a call wall? Why did SPX stall at 7,500?
- A call wall is the strike above spot with the heaviest positive dealer gamma.
- Dealers there must sell into rallies approaching the strike; that selling caps price.
- Walls are mechanical, not chart magic, and they roll as open interest shifts overnight.
- Watch wall size in dollars per 1% move, not just where it sits on the chart.
A call wall is the strike above spot where positive dealer gamma piles up. Dealers hedging those calls are long delta on the way up, so when SPX rallies toward the strike, they have to sell futures to stay flat. That selling is mechanical, size-scaled to gamma at the strike, and it stacks up every time price presses in.
Let's make it concrete. As of the 21 Sep 2026 snapshot (10:25 ET), SPX's call wall sits at 7,800. Right now it carries +$4.7B per 1% move. A rally 1% into that strike meets a mechanically-priced supply of futures. That's not a chart pattern; it's arithmetic.
Where retail sees resistance, the map sees a hedging obligation. The number is the difference. A $4.4B wall behaves nothing like a $0.4B wall, even if both look the same on a chart.
| Stage | Dealer flow | Price behavior | What to watch |
|---|---|---|---|
| Approaching | Steady selling to stay flat | Slower into the strike | Wall size in $ per 1% vs cushion |
| At the wall | Peak selling per point | Stalls; often three-touches | GEX steady or growing = wall intact |
| Past the wall | Selling weakens quickly | Extension possible | Does the wall roll higher next refresh |
What happens when price breaks the call wall?
- Past the wall, the brake fades: deep-ITM calls carry little gamma.
- The forced selling that capped price weakens as price extends past the strike.
- Watch the next refresh: does the wall roll higher, or does it stay put.
- Wall-rolls-higher is orderly continuation; wall-stays-put is closer to exhaustion.
When SPX breaks a call wall, the dampening flow doesn't stop cold. It fades over the next few dollars. Options that were near-the-money at the strike are now in-the-money, and deep-ITM calls carry very little gamma. Dealers no longer need to hedge as sharply. The brake fades.
What replaces the brake depends on what the book does next. If overnight open interest adds sit above the breach strike, the wall rolls higher; the market has layered new resistance on top. If open interest doesn't add, the breach was a clean extension into thin book. Both look identical on a chart in the moment, and they behave differently over the next two sessions.
| Moment | Mechanic | Signal to read |
|---|---|---|
| At breach | Gamma at strike moves ITM; forced selling weakens | GEX at the wall drops fast |
| Next refresh (15 min) | New OI decides whether the wall rolls | Wall migrates higher, or holds |
| Next session | Book redraws overnight; new wall visible or absent | Rolls = continuation; absent = exhaustion risk |
What is a put wall? Does price bounce there or break?
- A put wall is the strike below spot with the heaviest negative dealer gamma.
- Selloffs often accelerate INTO put walls (short gamma amplifies), then react hard at the strike.
- Put-wall breaks are usually violent; call-wall breaks are usually orderly.
- Watch GEX sign after the touch: if it flips positive, the reaction sticks.
A put wall is the negative-gamma twin below spot. It's the strike where dealers hold the largest short-put exposure, so their hedge is short underlying. As SPX drops toward it, gamma works against them; they have to sell into the drop to stay flat. That amplifies the selloff into the wall.
The reaction at the wall is where the mirror ends. At the strike, the short puts flip into deep-ITM territory. Dealer gamma there collapses, and the hedging that fueled the drop stops. If the reversal sticks, the book flips positive-gamma at that strike and dealers start buying dips.
The asymmetry with call walls is important. Call walls break orderly because the brake fades. Put walls break violently because the accelerator often continues below the strike into the next put wall or the flip line.
| Phase | Dealer flow | Price behavior | Trader read |
|---|---|---|---|
| Approach | Selling amplifies the drop | Acceleration into the strike | Widen stops or step aside |
| Touch | Gamma collapses; forced selling stops | Sharp reaction | Watch for GEX sign flip |
| Break | Continuation into next negative-gamma pocket | Often violent | Next put wall or the flip line is the target |
What is the gamma flip and what happens when we cross it?
- The gamma flip is the price level where net dealer gamma changes sign.
- Above the flip: dealers dampen moves. Below: they amplify.
- Distance-to-flip is the safety margin; wide cushion is durable, narrow cushion is fragile.
- REGIME TRANSITION (amber) names the state when spot is right at the flip; volatility can pick up either way.
The gamma flip is the level where net dealer gamma crosses zero. Above it, dealers hold a net long-gamma book: they dampen moves. Below it, they hold a net short-gamma book: they amplify them. Crossing the flip mid-session flips the whole day's character.
Distance-to-flip is a safety margin. As of the 21 Sep 2026 snapshot (10:25 ET), SPX's flip sits at 7,655, with spot at 7,721. That distance is the cushion between spot and the regime line; a wide cushion is a durable regime and a narrow one is fragile. Same sign, very different behavior.
When spot lands close to the flip, the dashboard names the state REGIME TRANSITION and colors it amber. Not green, not red. Amber is the honest color: the book is undecided, and volatility can pick up either way. Treat it as neither risk-on nor risk-off; the mechanical read has no strong signal until price commits.
| State | Regime | Volatility | Posture |
|---|---|---|---|
| Above flip (green cushion) | Positive: bowl | Compressed | Fade the edges |
| At flip (amber) | REGIME TRANSITION | Undecided | Reduce size; wait for commit |
| Below flip (red slope) | Negative: hill | Expanded | Trade with the move |
What are shelves, GEX peaks (★) and DEX peaks (◇)?
- Shelves are secondary strikes between the walls where price often steps through.
- GEX peaks (★) mark strikes with the heaviest gamma in the visible book.
- DEX peaks (◇) mark strikes with the heaviest standing delta weight.
- Shelves matter more on trend days; on chop days the walls dominate.
Between the call wall and the put wall, price rarely runs in a straight line. It staircases between smaller strikes with meaningful gamma. Those steps are shelves. Each shelf is a smaller version of a wall: enough gamma to slow the move, not enough to stop it.
The dashboard marks the two peak types on the map. A star (★) marks a GEX peak: the strike with the highest dealer gamma in the visible book, wall or not. A diamond (◇) marks a DEX peak: the strike with the heaviest standing delta weight. Peaks and walls often coincide. When they don't, the mismatch is a signal in itself.
Shelves earn their name on trending days, when the book unspools one step at a time. On chop days, they compress and the walls do all the work.
| Glyph | Name | Reads as |
|---|---|---|
| ▲ | Call wall | Heaviest positive GEX above spot |
| ▼ | Put wall | Heaviest negative GEX below spot |
| △ ▽ | Shelves | Secondary gamma steps (up / down) |
| ★ | GEX peak | Heaviest gamma strike in view |
| ◇ | DEX peak | Heaviest standing delta strike |
What is the Book Anchor?
- The Book Anchor is the heaviest strike at the next monthly OPEX expiry.
- It's the month's magnet, even when spot is far from it.
- On the dashboard it renders as a bare BOOK ANCHOR chip, no glyph, on purpose.
- ▲▼△▽★◇ are reserved for gamma structure; the anchor gets its own vocabulary.
The Book Anchor is the heaviest strike at the next monthly OPEX expiry. It's not always near spot. It's the month's magnet: the strike that concentrates the most dealer inventory at the biggest scheduled unwind of the calendar. As price drifts through the month, that anchor exerts a slow pull that is different from the day-to-day wall pull.
The dashboard names the anchor with a bare BOOK ANCHOR chip, no glyph. That's deliberate. The gamma structure vocabulary (▲ call wall, ▼ put wall, △▽ shelves, ★ GEX peak, ◇ DEX peak) is reserved for what dealers must trade per 1% move. The anchor is a different animal: monthly-OPEX concentration, not per-1% flow. Giving it its own chip prevents mixing the two reads.
When spot converges toward the anchor into the last week of a monthly cycle, expect chop. When it diverges, the wall matters more.
| Chip | What it measures | When it matters | Vocabulary |
|---|---|---|---|
| BOOK ANCHOR | Heaviest strike at monthly OPEX | Every day, more into OPEX week | Bare chip, no glyph, on purpose |
| ▲ CALL WALL | Heaviest positive GEX per 1% move | Every session, intraday | Gamma structure glyph |
| ▼ PUT WALL | Heaviest negative GEX per 1% move | Every session, intraday | Gamma structure glyph |
Do these levels actually work as support and resistance?
- Sometimes yes, sometimes no; the honest read is mechanical, not narrative.
- They mark strikes where dealer hedging flow concentrates, which often looks like S/R.
- They hold when regime and OI at the strike stay stable through the test.
- They fail when regime flips, the strike rolls off after expiry, or real news overrides flow.
Sometimes yes, sometimes no. The honest read.
Gamma levels mark strikes where dealer hedging flow concentrates. That flow often looks like support and resistance from the outside: rallies stall at heavy positive-gamma strikes above spot, dips reverse at heavy strikes below. It looks like S/R because it acts like S/R in aggregate. It is not the same thing.
Levels hold when three conditions cooperate: regime sign at the strike stays put through the test, open interest doesn't collapse between refreshes, and no real news catalyst hits mid-test. Levels fail when any of those move. A regime flip mid-session flips the read entirely. A strike rolling off after expiry deletes the level from the book. Real news is the honest override.
The dashboard refuses to call these support and resistance because those words promise causation that mechanical flow doesn't carry. Flow is why the shape appears. Flow is not why price is at a level.
| When they hold | When they fail |
|---|---|
| Regime sign at the strike stays put through the test | Regime flips mid-session |
| OI at the strike stays stable between refreshes | OI collapses (typically at monthly OPEX) |
| No news catalyst hits mid-test | Real news overrides flow |
| Distance-to-flip is meaningful | Spot lands within the amber-transition band |
| Peak Gamma concentration steady at the wall's expiry | Peak Gamma expiry rolls (post-OPEX) |
D. Timing: expiry and OPEX
Full section coming in R2. Anchors scaffolded below.
What is OPEX and why does everyone talk about it?
- OPEX is options expiration: the day contracts settle and OI at expired strikes rolls off the book.
- Weekly, monthly, and quarterly cycles matter; monthlies (3rd Friday) concentrate the most dollars.
- On OPEX day, the book redraws overnight; Friday's map is not Monday's map.
- The Book Anchor is the current monthly OPEX's heaviest strike.
OPEX is short for options expiration, the day contracts settle and the open interest at the expired strikes rolls off the book. It happens every Friday for weekly options, on the third Friday of each month for monthlies, and quarterly for the biggest ones (March, June, September, December).
Monthly OPEX is the one that matters most for the map. Monthlies carry more open interest than weeklies at the same strike, so the gamma piled at a monthly strike is bigger and the dealer positioning tied to it is heavier. When those monthlies roll off, a lot of dealer inventory disappears at once, and the book redraws.
Post-OPEX, walls can move, the flip can shift, and yesterday's read stops being today's read. Treat OPEX Friday as a scheduled discontinuity, not a normal session close.
| Cycle | Cadence | Weight in the map | Notes |
|---|---|---|---|
| Weekly | Every Friday | Light | Fast OI turnover |
| Monthly | 3rd Friday of the month | Heaviest | Book Anchor sits here |
| Quarterly | Mar / Jun / Sep / Dec | Very heavy | Multi-week concentration |
What is gamma pinning? Why does the market pin on expiry days?
- Gamma pinning is the mechanical drift toward the strike with the most dealer gamma as expiry approaches.
- Positive dealer gamma at a heavy strike forces market makers to sell rallies away from it and buy dips back to it.
- Strongest when a single strike holds a large share of the day's OI and the book is net long gamma there.
- Pins fail when the book flips short gamma, or a big customer hedges through the pin.
Gamma pinning is a mechanical drift toward the strike carrying the most dealer gamma as expiry approaches. Positive dealer gamma at a heavy strike forces market makers to sell rallies away from it and buy dips back toward it, which tightens price around that strike into the close.
The effect is strongest when a single strike holds a large share of the day's open interest and the book is net long gamma there. As DTE shrinks toward zero, gamma spikes at strikes near spot, so the mechanical grip gets tighter in the final hours.
Pins fail predictably. When the book flips to short gamma at the pin strike, dealers start selling into the drop and buying rallies, breaking the drift. When a big customer hedges through the pin (a real block trade forcing dealer flow the other way), the mechanical read gets overridden by the flow.
| Component | Mechanic | Signal on the dashboard |
|---|---|---|
| Heavy strike + short DTE | Gamma spike near spot | Peak Gamma card + Combined view |
| Net long gamma at strike | Dealers sell rallies, buy dips | Sign at strike is positive |
| High OI share at strike | Concentration force | ★ GEX peak at strike |
| Customer block trade | Overrides the drift | Wall migrates intraday |
What changes after OPEX?
- Post-OPEX, the book redraws overnight: expired OI rolls off, next-month positions activate.
- Walls can move, the flip can shift, and yesterday's map stops being today's map.
- The first Monday after monthly OPEX is a rebuild session; take the map with fresh eyes.
- The Book Anchor updates to the new monthly cycle's heaviest strike.
Post-OPEX, the book redraws overnight. Open interest at the expired strikes disappears. Positions rolled or opened for the next monthly cycle become active. The walls, the flip, and the Book Anchor all shift.
The first session after a monthly OPEX is a rebuild session. Traders reading Friday's map into Monday's tape end up trading yesterday's book, not today's. Wall migration is normal; the flip line can move 20 or 30 points on SPX just from the calendar roll. A regime that read positive on Friday can read negative on Monday, with no market news between.
The honest read is to open the map on Monday morning without carry-over. Look at where the walls now sit, where the flip now is, and what the anchor now names. The mechanism refreshes weekly; the trader who refreshes with it wins the first hour.
| Phase | Book state | Typical behavior |
|---|---|---|
| Friday close (OPEX) | Old book fully priced | Pin drift toward heaviest strike |
| Sunday overnight | Expired OI rolls off; new positions activate | Map redraws in the background; no visible action |
| Monday open | New book fully visible | Walls have moved; flip has moved |
| Monday first hour | Traders adjust to the new map | Lagging Friday's read performs poorly |
0DTE gamma exposure. Why do 0DTE levels change during the day?
- 0DTE view shows only options expiring today; Multi-Day shows the whole map.
- 0DTE gamma is largest right before expiry, so 0DTE strikes react sharpest per point.
- 0DTE levels change intraday because the 0DTE book reprices continuously as new contracts trade.
- Use 0DTE for intraday level reads; use Multi-Day for the day's regime and structure.
0DTE gamma is the dealer gamma exposure from options expiring the same day. Because gamma is largest right before expiry, 0DTE strikes carry the sharpest hedging response per point of price movement. That's why intraday levels move faster on the 0DTE view than on the multi-day view.
The 0DTE book also reprices continuously through the session as new 0DTE contracts trade. The map at 10 AM ET is not the map at 2 PM ET. Levels appear, migrate, and disappear inside the session.
Use each view for what it's built for. 0DTE is the intraday microscope: the fast-reacting levels for the current session. Multi-Day is the wide-angle: the day's regime, the walls that anchor multiple sessions, and the Book Anchor for the month. Reading only one is reading half the map.
| View | What you see | When to use |
|---|---|---|
| 0DTE | Today's expiring book only | Intraday level reads, scalps, near-close positioning |
| Multi-Day | The whole book across expiries | Regime, walls, Book Anchor, longer-holds |
| Toggle both | Same panels, different data | When 0DTE disagrees with the wide view at the same strike |
What is Peak Gamma? Why does one expiry hold 46% of the gamma?
- Peak Gamma is the expiry holding the largest share of net dealer gamma today.
- Concentration percentage tells you how much of the book sits at that single expiry.
- Above 40% is a heavy pin-risk read near that expiry's date.
- Concentration spread across many expiries is a chop book with distributed levels.
The Peak Gamma card names the expiry that holds the largest slice of today's gamma. It shows the expiry date and the concentration percentage: what fraction of net dealer gamma sits at that single expiry.
Concentration matters because gamma effects are per-expiry-plus-per-strike. A book that holds 46% of its gamma at a single expiry behaves nothing like a book that holds 12% at the same expiry, even if the net headline is identical. Concentrated books pin harder into their heavy expiry; distributed books drift.
The threshold worth knowing is roughly 40%. Above that, the pin risk near that expiry's date grows sharply. Below 20%, the book is genuinely distributed and no single expiry drives the tape.
Read Peak Gamma alongside the Book Anchor. When the Peak Gamma expiry equals the current monthly OPEX, the pin risk into that Friday is at its highest.
| Concentration | What it means | Trader implication |
|---|---|---|
| below 20% | Distributed book | Chop; walls drift; weak pin |
| 20 to 40% | Moderate concentration | Watch the heavy expiry more closely |
| above 40% | Heavy concentration | Pin risk into the expiry date grows sharply |
Does gamma get stronger near expiry?
- Yes, sharply. Gamma at ATM strikes rises steeply as DTE shrinks toward zero.
- 0-1 DTE options accrete gamma fastest; beyond 20 DTE, gamma flattens out.
- Dealer hedging sharpens as DTE shrinks and spot approaches heavy strikes.
- The gamma-vs-DTE curve steepens into OPEX, then resets after the calendar roll.
Gamma at a strike is largest when that strike is at-the-money and expiry is near. It's a curve, not a step: as DTE shrinks toward zero, gamma at ATM strikes rises sharply. Beyond 20 or so DTE, gamma flattens out and behaves more like a long-term exposure.
That's why 0DTE strikes feel sharper than weekly strikes and weekly sharper than monthly. Same strike, same OI, different gamma just because of time-to-expiry. Dealer hedging response tracks that curve exactly: sharper reactions at the ATM near-expiry strikes, softer reactions at ATM far-expiry strikes.
The whole gamma-vs-DTE curve steepens as OPEX approaches, and resets after the calendar roll. That's the underlying reason 0DTE and Multi-Day disagree more into an OPEX Friday: the near-expiry side of the book is dominant.
| DTE | Relative gamma at ATM | Hedging response |
|---|---|---|
| 0 to 1 | Peak | Sharpest per-point |
| 1 to 5 | Very high | Sharp |
| 5 to 20 | Moderate | Steady |
| 20+ | Flat | Slow, background |
E. Trading with it
Playbooks, the workflow, and the seasoned-trader trust sections: when the map works, and when it doesn't.
What makes the read bullish or bearish?
- The read is structural lean, not a signal.
- Bullish lean: above the flip, positive GEX rising, call-tilted DEX defended, put wall holding.
- Bearish lean: below the flip, negative GEX expanding, put-tilted DEX below, rejections at the call wall.
- Real news breaks any lean; the map informs, it does not decide.
The read is structural lean, not a signal. What you're doing is checking which side of the map has more forced-flow support behind it. Bullish lean shows when net GEX is positive above the flip, DEX is call-tilted overhead in a way that dealers hedge by owning underlying, and the put wall is holding recent tests. That combination means dealers dampen moves down and buy into dips.
Bearish lean shows when net GEX is negative and expanding, spot sits below the flip, DEX is put-tilted below, and rallies reject at the call wall. Dealers amplify drops and cap rallies mechanically.
The honest caveat every time: lean is not a signal. Real news can override any structural read on any day. Use lean to size positions and pick playbooks (E2-E6), not to decide whether to trade.
| Bullish lean | Bearish lean |
|---|---|
| Spot above the flip | Spot below the flip |
| Net GEX positive and rising | Net GEX negative and expanding |
| Call-tilted DEX overhead being defended | Put-tilted DEX below with heavy weight |
| Put wall holding recent tests | Rallies rejecting at the call wall |
| Peak Gamma concentration steady | Peak Gamma expiry rolling toward heavy short-gamma |
It's a long-gamma day. What trades fit?
- Fade the edges: sell rallies into the call wall, buy dips at shelves and the put wall.
- Premium selling structures inside the walls (iron condors, credit spreads anchored to the walls).
- Range compresses through the session; time is on your side.
- Invalidated by wall breach with wall rolling higher, or by flip loss.
On a long-gamma day, dealers dampen. The playbook is fade the edges: sell rallies into the call wall, buy dips at shelves or the put wall. Premium-selling structures fit because range compresses through the session; iron condors and credit spreads anchored to the visible walls give you defined risk and let time work for you.
Position sizing can be normal because moves are constrained. Wider stops aren't needed; if anything, tighter is better because reversals come fast.
What invalidates the read is precise. A wall breach with the wall rolling higher on the next refresh flips the map for that side. A flip loss (spot crossing below the gamma flip) flips the entire day's character. Both are visible on the dashboard the moment they happen; the trade off-ramp is not vague.
| Component | Long-gamma choice | Where on the dashboard |
|---|---|---|
| Setup | Fade the edges | Regime card = POSITIVE |
| Entry | Sell rallies into ▲; buy dips at ▽ shelves | GEX Structure Map |
| Stop | Tight; range is compressed | Wall dollar size |
| Target | Middle of the walls | Distance-to-flip band |
| Invalidator | Wall breach + roll, OR flip loss | Regime card |
It's a short-gamma day. What changes?
- Trade with the move, not against it. Wider stops, smaller size.
- Long-options structures (debit spreads, straddles) because moves extend and IV runs.
- Fading against the trend is the losing trade of the day.
- Invalidated by spot reclaiming the flip.
On a short-gamma day, dealers amplify. The playbook is the opposite of long-gamma: trade with the move, not against it. Wider stops because moves extend, smaller size because gaps happen, long-options structures because IV tends to run.
Debit spreads and straddles fit the regime because they benefit from the same trend expansion that hurts premium sellers. Fading a move against the trend is the losing trade of the day; the same dealer hedging that drove the move continues to drive it until the flip is reclaimed.
The invalidator is spot reclaiming the flip. Once above the flip line, the book flips regime and dampening resumes. Until then, the map is telling you to run with what you have.
| Component | Short-gamma choice | Where on the dashboard |
|---|---|---|
| Setup | Trade with the move | Regime card = NEGATIVE |
| Entry | Long-strike structures (debit spreads, straddles) | Combined view |
| Stop | Wider than usual | Distance-to-flip |
| Target | Next negative-gamma pocket below | GEX Structure Map |
| Invalidator | Reclaim of the flip | Regime card |
How do traders play the flip itself?
- Reclaim and loss are two different trades at the same line.
- Reclaim (below to above): fade the next pullback back into the flip.
- Loss (above to below): treat the cross as a regime-change signal, not just a level breach.
- Same level, two personalities.
The flip trade is playing the regime change itself. Reclaim and loss are two different trades at the same line, and running them the same way is a common way to lose money on both.
Reclaim (spot crosses from below the flip to above): the regime flips from short-gamma to long-gamma. The trade is fading the next pullback back into the flip line, because dampening flow now defends the crossing. Position for compressed range going forward.
Loss (spot crosses from above the flip to below): the regime flips from long-gamma to short-gamma. Do not fade. Treat the loss as a regime-change signal and switch to short-gamma playbook (E3) immediately. Wider stops, smaller size, longer strikes. What was a bowl is now a hill.
| Direction | New regime | The trade | Position size |
|---|---|---|---|
| Reclaim (up through flip) | Long-gamma resumes | Fade next pullback into the flip | Normal |
| Loss (down through flip) | Short-gamma begins | Switch to E3 playbook; do not fade | Reduced |
How do traders play OPEX pins?
- Pin candidates: heavy strike + short DTE + net long gamma at the strike + high OI share.
- Structures: butterflies, iron flies, short straddles at the magnet strike.
- Defined risk always; the pin is a probability, not a guarantee.
- Watch the last-hour GEX drift at the strike to catch a failing pin early.
The OPEX pin trade takes advantage of the mechanical drift that pinning creates. Pin candidates are strikes with three ingredients present: heavy OI concentration at that strike, short DTE (0-3 typically), and a net long-gamma dealer read at the strike.
Structures fit the mechanic. Butterflies and iron flies at the pin strike give you defined risk and pay if price finishes near the magnet. Short straddles at the strike are the higher-payoff, higher-tail-risk cousin; only run them if you can define the tails somehow.
The last hours are where the pin either lands or fails. Watch the GEX drift at the strike in the last hour of trading. If the sign is stable and net long gamma is holding, the pin is on. If GEX starts drifting toward zero or flips, the pin is failing and price will drift away from the strike.
| Step | Check | Signal on the dashboard |
|---|---|---|
| Find candidate | Heavy strike + short DTE + long gamma | Peak Gamma + ★ at the strike |
| Structure | Butterfly, iron fly, defined-risk short straddle | Defined risk always |
| Entry | Session open or early afternoon | 0DTE view |
| Watch | Last-hour GEX at the strike | Regime card at the strike |
| Exit | GEX drifts to zero or flips sign | Pin failing |
How should I trade 0DTE with this?
- 0DTE near-walls are the intraday levels; treat them as day trades, not swings.
- Hedging flow is fast in 0DTE; size down and widen mental stops.
- Pre-open: check Peak Gamma, walls, flip, then flip to 0DTE view.
- Power hour is when 0DTE levels do their sharpest work.
0DTE is a different rhythm. The near walls in the 0DTE view are the intraday levels for today. Treat them as day-trade markers, not swing levels; they will change through the session.
Because 0DTE gamma is sharpest, hedging flow reacts faster. Size down from normal, widen mental stops, and expect walls to move on you mid-session. A wall that showed up at 10 AM ET can be gone by 2 PM ET.
The workflow that fits is checkpoint-based, not continuous. Pre-open: read Peak Gamma, the walls in Multi-Day, the flip, then flip to 0DTE view. First hour: mark the intraday levels and pick a playbook. Midday: re-check the 0DTE view for level migration. Power hour: watch the pin candidates. The dashboard rewards checkpoints; watching it tick doesn't.
| Time | Check | Purpose |
|---|---|---|
| Pre-open | Multi-Day walls, flip, Peak Gamma | Regime and structure |
| First hour | 0DTE view; mark intraday levels | Pick playbook (E2 or E3) |
| Midday | 0DTE level migration | Adjust or exit |
| Power hour | Pin candidates + last-hour GEX drift | Late-session pin trade |
When does this NOT work?
- Real news overrides flow. The map still shows the mechanical response but does not call the direction.
- Thin books misrepresent structure; low-OI sessions read noisier than they should.
- Regime transitions (amber) are the honest "we don't know" zone.
- Post-OPEX Mondays are book-redraw days; carry-over reads perform poorly.
- Heavy offsetting books hide the level meaning behind the headline.
Every honest map has an out-of-scope zone. Here's when the gamma map is out of scope.
Real news overrides flow, most of the time. Fed emergency, geopolitical shock, large-cap earnings miss: these events don't respect dealer hedging. When news is the driver, the map shows the mechanical response but does not call the direction. Reduce size or step aside.
Thin books misrepresent structure. Low-OI sessions have less mechanical inertia; a wall that would matter with $50B gross behind it behaves like paper at $5B. The dashboard's coverage stats on the footer are your check.
Regime transitions (amber) are the honest "we don't know" zone. Push conviction into an amber read at your own risk; the mechanism itself is undecided.
Post-OPEX Mondays are book-redraw sessions; the whole map is being reprinted underneath you. Take fresh reads.
Heavy offsetting books hide meaning behind the headline. When the offset ratio is near 0.05, the labeled regime is nominally there but the levels do all the work.
| Failure mode | Signal on the dashboard | Posture change |
|---|---|---|
| Real news event | Not on the dashboard (external) | Reduce size or step aside |
| Thin book | Coverage stats show low OI and expiries | Halve size or step aside |
| Regime transition (amber) | Regime card amber | Wait for commit |
| Post-OPEX Monday | Book Anchor date rolled | Ignore Friday's read |
| Heavy offsetting | Offset ratio near 0.05 | Trade the levels, not the label |
What's a realistic workflow? Walk me through a morning.
- Five minutes. Not fifty. The routine's job is to make the first trade obvious.
- 0 to 2 min: regime and distance to flip.
- 2 to 4 min: walls and Book Anchor.
- 4 to 5 min: DEX tilt and Peak Gamma.
- By 09:30 ET: playbook picked (E2 / E3 / E5 / E6).
A five-minute routine that lands you at 09:30 ET with a picked playbook.
0-2 min: regime card and distance-to-flip. Which map are we on today: bowl, hill, or amber transition. This is the whole rest of the day's posture; no other check overrides this one.
2-4 min: walls and Book Anchor. Where does flow concentrate above and below spot. Note the dollar sizes, not just the levels; a $4B wall and a $0.4B wall are different trades even at the same strike.
4-5 min: DEX tilt at spot and Peak Gamma concentration. Which way does the book lean, and how concentrated is it at a single expiry.
By 09:30 ET: pick the playbook. Long-gamma day gets E2. Short-gamma day gets E3. OPEX pin candidate gets E5. Heavy 0DTE concentration gets E6.
| Minute | Check | Question answered |
|---|---|---|
| 0-2 | Regime + distance to flip | Which map today |
| 2-4 | Walls + Book Anchor | Where flow concentrates |
| 4-5 | DEX tilt + Peak Gamma | Lean + concentration |
| by 09:30 ET | Pick playbook | E2 / E3 / E5 / E6 |
What do seasoned traders check before taking the trade?
- Five checks: regime agrees, level has real size, distance to flip meaningful, expiry concentration on your side, invalidation defined.
- 5 of 5 = take size. 4 of 5 = normal size. 3 of 5 = light size. 2 of 5 or fewer = pass.
- The tally is honesty converted into a position size.
Seasoned traders don't take every trade the map suggests. They run through a five-check confidence checklist first, and the number of checks that pass decides the size and the conviction.
Each check is short. Regime agrees with the trade direction. The level has real size in dollars (not just position on the chart). Distance-to-flip gives you a durable regime cushion. Peak Gamma concentration is on your side of the tape. Invalidation is defined before entry, in a specific number.
The tally is what you actually trade. All five agree, take size. Four, take normal. Three, take light. Two or fewer, pass the trade. The checklist is not a rule; it's the discipline that converts the map into decisions.
- Regime agreesThe regime card matches your trade direction. Bullish trades want positive GEX above the flip; bearish trades want negative GEX below the flip. Amber transition is neither.
- Level has real sizeThe wall or shelf you're trading has meaningful dollar weight per 1% move. A $4B wall beats a $0.4B wall at the same strike.
- Distance-to-flip is meaningfulThe cushion between spot and the flip line is wide enough that the regime is durable through your holding period. Narrow cushion is a fragile setup.
- Expiry concentration is on your sidePeak Gamma expiry aligns with your holding horizon. A near-expiry concentrated book helps intraday trades; a distributed book helps swings.
- Invalidation is definedBefore entry, you know which specific dashboard signal exits you: wall breach with roll, flip loss, GEX drift at the strike. Not a vague price stop, a mechanism.
F. The dashboard, panel by panel
Reference manual for every panel on /gex. Each section names the panel, decodes what you see, and points to which live element carries which meaning.
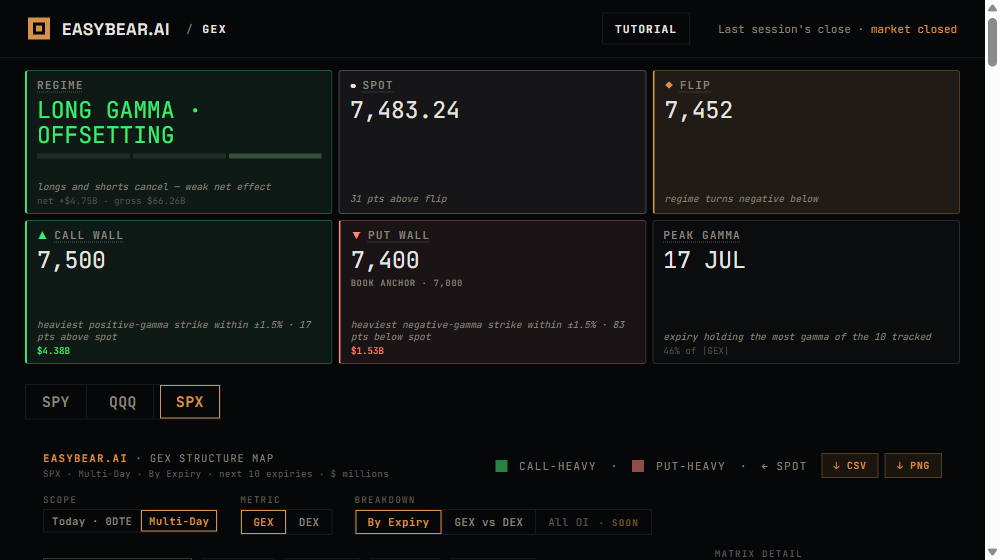
What do the six cards at the top tell me?
- The hero strip shows Regime, Spot, Flip, Call Wall, Put Wall, and Peak Gamma in one glance.
- Each card has a big number, a one-line teaching sub-line, and a facts row underneath.
- Read them left-to-right: regime first, then spot vs flip, then the two walls, then Peak Gamma concentration.
- The Put Wall card carries a "BOOK ANCHOR · NNNN" sub-line when the anchor sits below spot.
The six hero cards are the fastest read on the page. Left to right you get the regime label (LONG GAMMA / SHORT GAMMA / OFFSETTING / NEUTRAL / TRANSITION), current spot with distance-to-flip, the flip level, the call wall strike, the put wall strike (with a Book Anchor sub-line if applicable), and the Peak Gamma expiry with concentration percentage.
Each card has three tiers of information. Big number on top for scan-reading. Teaching sub-line in muted text underneath for a one-sentence read of what the number means. Facts row below that for the numbers the read is derived from (net vs gross for regime, gross exposure for walls, and so on).
The card teaching lines are written for beginners; the facts rows are for the seasoned trader who wants the derivation.
 1
2
3
4
5
6
1
2
3
4
5
6
- 1 Regime · the sign and offset state of the book
- 2 Spot · the underlying's price with distance to flip
- 3 Flip · the level where net dealer gamma changes sign
- 4 Call Wall · the heaviest positive-gamma strike near spot
- 5 Put Wall · the heaviest negative-gamma strike near spot (with Book Anchor sub-line when applicable)
- 6 Peak Gamma · the expiry holding the largest share, with concentration %
What am I looking at in the structure map?
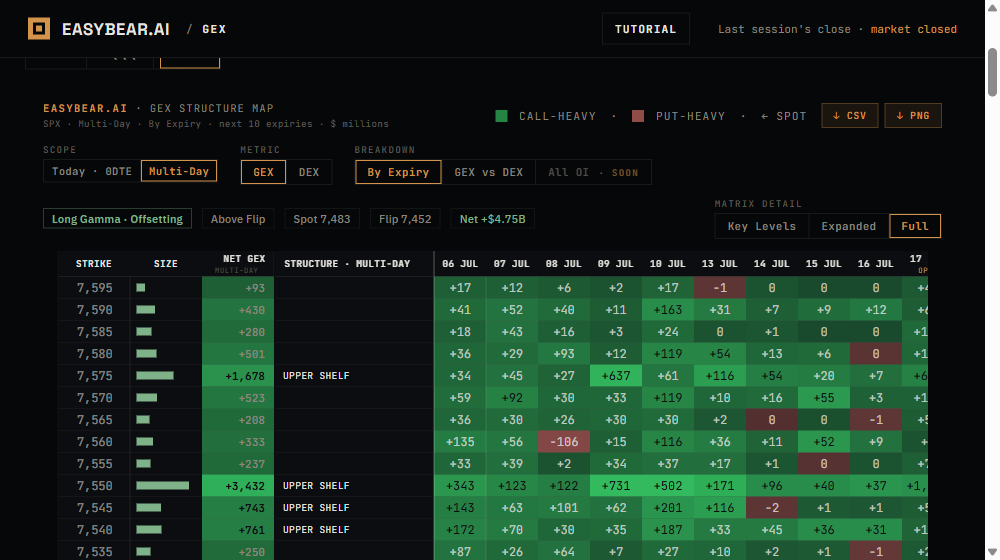
- The structure map is the by-expiry heatmap: rows are strikes, columns are expiries.
- Cell color intensity encodes gamma magnitude at that strike + expiry pair.
- Column colors are scaled to that column's own max, not the whole map.
- Under GEX view the color scale is emerald (positive) and coral (negative); under DEX view it swaps to cyan.
The structure map is the heatmap that shows how gamma or delta exposure lives across strikes and expiries. Rows are strikes ordered by price; columns are expiries ordered left to right by date. Each cell colors the exposure at the row's strike, in the column's expiry.
Cell color intensity is scaled to its own column's max. That is deliberate: a bright cell in a small-book expiry does not mean the same absolute dollars as a bright cell in a heavy expiry. Read within a column, not across.
Color meaning swaps by view. Under GEX view, emerald means positive gamma and coral means negative. Under DEX view, the scale switches to cyan for delta weight. The scale strip beneath the map names the color meaning explicitly.
How do I read the GEX vs DEX view?
- The Combined table shows GEX and DEX side by side for every visible strike.
- Glyphs on each row name the strike role: ▲ call wall, ▼ put wall, △▽ shelves, ★ GEX peak, ◇ DEX peak.
- The DEALER BEHAVIOR column decodes the mechanical response in plain words per row.
- Bar scaling is per-column-own-max: read within GEX or within DEX, never across.
The GEX vs DEX view is the reference table that most seasoned traders live in. Every visible strike is one row. Two bar columns show that strike's GEX and DEX, each scaled to its own column's max. The DEALER BEHAVIOR column decodes the mechanical response in a short phrase (Dampen, Amplify, Standing weight, Regime pivot, and so on).
The glyph on the left of each row names the strike role. ▲ call wall (heaviest positive GEX above spot), ▼ put wall (heaviest negative below), △▽ secondary shelves, ★ GEX peak (heaviest gamma in view, wall or not), ◇ DEX peak (heaviest standing delta). The Book Anchor uses a bare BOOK ANCHOR chip with no glyph, on purpose: ▲▼△▽★◇ are reserved for gamma structure; the anchor is a monthly-OPEX magnet and gets its own vocabulary.
The legend text changes with the view. Under GEX it reads call-heavy / put-heavy; under DEX it swaps to call-tilted / put-tilted, because gamma at a strike is about forced trading per 1% move while delta is about standing weight. Two different mechanisms, two different words. When bars in one column pass roughly two-thirds of column-max, the DEALER BEHAVIOR column reads Strong; between one-third and two-thirds it reads Moderate; below that it goes silent for that row. The Regime pivot row appears at the flip level and, on narrow phone screens, wraps to three lines by design. The YOU ARE HERE divider marks spot; strikes above sit overhead and strikes below sit under. Fold bands (marked with [+]) collapse rows with light exposure so the important levels stay visible on one screen.
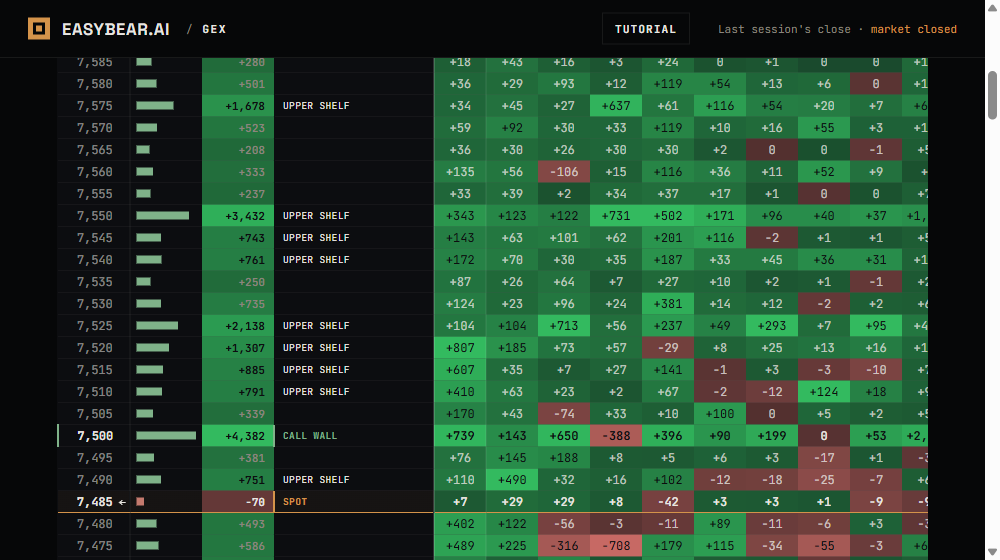
- 1 Glyph column · ▲▼△▽★◇ and the bare BOOK ANCHOR chip
- 2 Strike price
- 3 GEX bar (own-column scaling)
- 4 DEX bar (own-column scaling; cyan under DEX view)
- 5 DEALER BEHAVIOR (Strong / Moderate benchmark applied per column)
- 6 YOU ARE HERE divider · splits overhead from below-spot
| Glyph | Name | Meaning |
|---|---|---|
| ▲ | Call wall | Heaviest positive GEX above spot |
| ▼ | Put wall | Heaviest negative GEX below spot |
| △ ▽ | Shelves | Secondary gamma steps up or down |
| ★ | GEX peak | Heaviest gamma strike in view |
| ◇ | DEX peak | Heaviest standing delta strike |
| BOOK ANCHOR | Anchor chip | Heaviest monthly-OPEX strike (bare chip, no glyph, on purpose) |
What are Key Levels, Expanded, and Full?
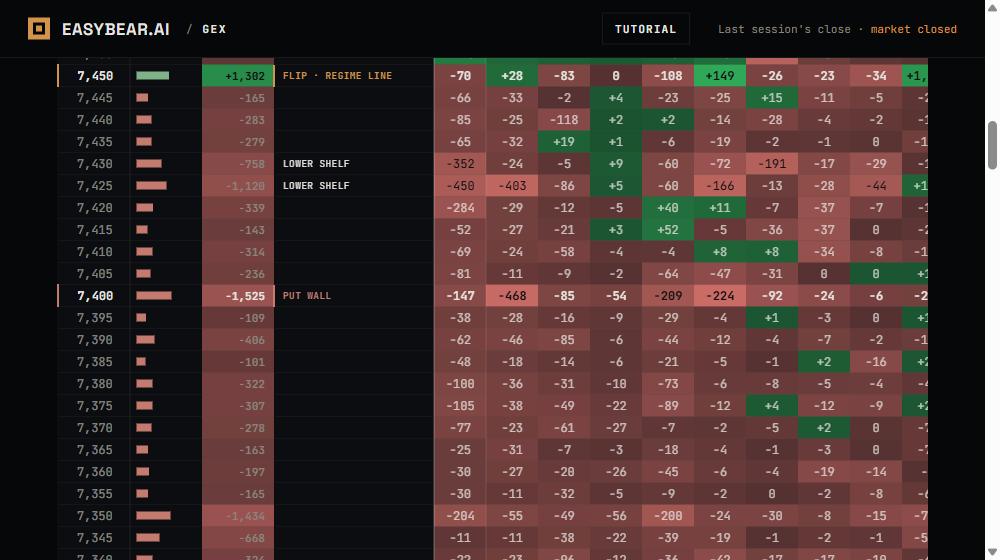
- Three density modes control how many strikes the Combined view shows.
- Key Levels shows walls, shelves, peaks, and spot only.
- Expanded shows key levels plus every strike within one wall-band of spot.
- Full shows every strike in view; fold bands collapse silent rows to save space.
The three density modes trade information density for scannability. Key Levels is the fastest read: just the strikes that carry a role (walls, shelves, peaks, spot). Expanded fills in the strikes near spot so you can see how price sits in the local structure. Full is the whole visible book, with fold bands hiding silent rows.
Use Key Levels for the whole-day read and the morning routine. Use Expanded for intraday scalping and pin-day tape reading. Use Full when you're diagnosing an unusual print or verifying a specific strike.
| Mode | What it shows | When to use |
|---|---|---|
| Key Levels | Walls, shelves, peaks, spot only | Whole-day read; morning routine |
| Expanded | Key Levels + strikes within one wall-band of spot | Intraday scalping; pin-day tape |
| Full | Every visible strike; fold bands collapse silent rows | Diagnostic / audit |
What's the curve chart?
- The profile curve plots net dealer gamma at every price level, not just at spot.
- Bowl shading (emerald) marks positive-gamma zones; hill shading (coral) marks negative.
- The flip line marks where the curve crosses zero.
- Curvature matters: a shallow bowl above the flip is a fragile regime.
The profile curve chart shows what the regime would be at each possible spot price. The X axis is price; the Y axis is net dealer gamma at that price. As price moves along X, the curve traces the exposure the book would carry.
The chart shades zones. Emerald above zero is the bowl (dampening / positive gamma). Coral below is the hill (amplifying / negative gamma). The flip line is where the curve crosses zero. Distance from spot to the flip line is your safety margin; the curvature near spot tells you how fragile that margin is.
What's in the right rail?
- Four stacked panels: Key Levels, GEX by Strike, Market Structure Read, Exposure by Expiry.
- Key Levels lists the walls, shelves, and Book Anchor in one column.
- GEX by Strike gives a compact bar chart of net GEX at each visible strike.
- Market Structure Read is a plain-English narrative of what the regime is doing now.
The right rail carries four stacked panels. Key Levels lists the strike roles in one column with their dollar sizes, so you can pick a wall or shelf at a glance without scanning the Combined table. GEX by Strike is a compact horizontal-bar chart of net GEX at each visible strike; it's the fastest read on strike-by-strike concentration.
Market Structure Read is a short narrative paragraph that summarizes the regime in plain English (positive regime with 31-point cushion above flip, and so on). Exposure by Expiry breaks Peak Gamma out into a bar chart across all visible expiries so you can see the concentration shape rather than just the top number.
What do the toggles do?
- Three toggles control what the panels show: Today · 0DTE vs Multi-Day, GEX vs DEX, and Structure Map vs GEX vs DEX view.
- Today · 0DTE narrows the whole page to same-day expiries; Multi-Day aggregates the next ten.
- GEX vs DEX switches the metric and the color scale (emerald / coral to cyan).
- Some toggle combinations grey out when a panel doesn't support them.
The toggles are how you steer the map. Today · 0DTE narrows every panel to same-day expiries; Multi-Day aggregates the next ten. GEX vs DEX switches the metric across every panel (heatmap, Combined table, curve, rail); the color scale swaps to cyan under DEX. The Structure Map vs GEX vs DEX view toggle switches the middle panel between the by-expiry heatmap and the strike-by-strike Combined table.
Panels grey out combinations they don't support. A ticker without per-strike delta will disable the DEX toggle with an honest tooltip; a market-closed session will disable the 0DTE toggle when there is no same-day book. Grey buttons are honest disabled states, not bugs.
| Toggle | Left state | Right state |
|---|---|---|
| Time scope | Today · 0DTE | Multi-Day (next ten expiries) |
| Metric | GEX (emerald / coral) | DEX (cyan) |
| View | Structure Map (by expiry) | GEX vs DEX (by strike) |
What do the footer flags mean?
- The TRANSPARENCY footer names every methodology choice in a single row.
- SIGN · INDUSTRY-STD, FLIP · CONTINUOUS, REGIME · SPOT-VS-FLIP, GREEKS · % LIVE, COVERAGE, and SRC.
- Each flag names one methodology decision plainly.
- If a flag would be false, we would name that too; nothing hides.
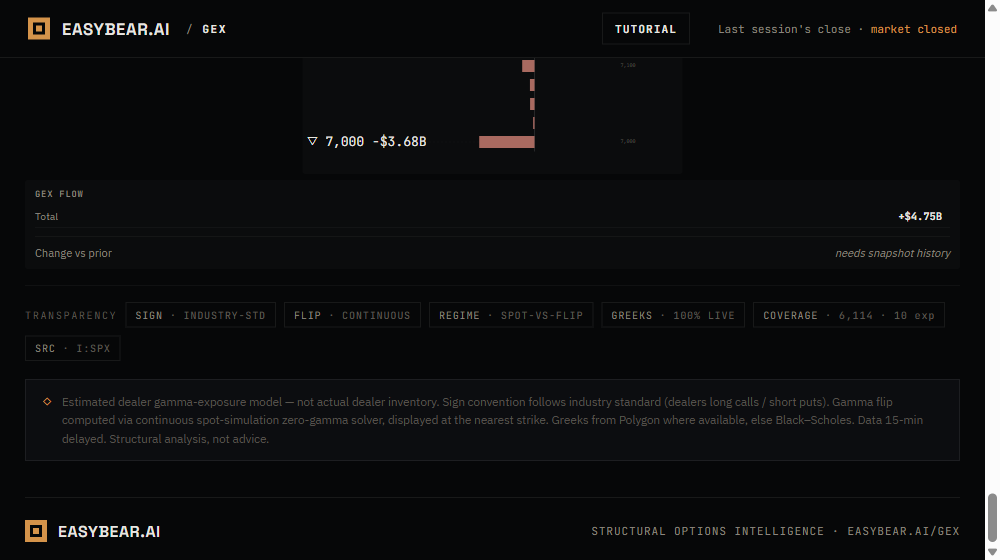
The TRANSPARENCY row is the footer strip below the panels. It states the methodology choices this build makes. SIGN · INDUSTRY-STD means dealers are modeled as long calls and short puts against the public. FLIP · CONTINUOUS means the flip is computed with a continuous-solver at zero-gamma rather than snapped to a strike. REGIME · SPOT-VS-FLIP means the labeled regime is spot's position relative to the flip line, not a compound score. GREEKS · % LIVE names the percentage of visible strikes carrying live per-strike greeks (with the remainder priced from the Black-Scholes fallback). COVERAGE names how many contracts and expiries feed the visible view. SRC names the underlying's chain source.
Can I export this?
- Yes. The Combined view exports CSV; the whole panel exports PNG.
- CSV rows carry every visible strike with GEX, DEX, and DEALER BEHAVIOR.
- PNG captures the panel as-rendered including the freshness stamp.
- Both exports carry the timestamp of the underlying data snapshot in the filename.
The Combined view offers CSV and PNG export. CSV includes one row per visible strike with columns for strike, GEX, DEX, glyph role, and the DEALER BEHAVIOR decoder text. PNG captures the panel as it looks on screen, freshness stamp and all.
Both exports embed the timestamp of the underlying data snapshot in the filename, so a CSV downloaded at 10:14 ET and one downloaded at 10:31 ET cannot be confused. The freshness stamp inside the PNG is the same 15-minute refresh cycle used everywhere else on the page.
How fresh is the data?
- Every panel refreshes every 15 minutes during US options market hours.
- When the market is closed the panel shows the last session's close snapshot with a market-closed notice.
- Every card, table, and chart shares the same 15-minute refresh cycle; no split freshness.
- If a ticker has no data right now, the panel says so explicitly.
The dashboard refreshes every 15 minutes during US options market hours. When the market is closed, the panel shows the last session's close snapshot with a market-closed notice in the topbar. All panels share the one cycle; there are no split freshness stamps to confuse.
When a ticker temporarily has no data (rare, temporary, usually a chain-source hiccup) the panel shows "No GEX data available for {T} right now" instead of blank cards or stale numbers. The message is explicit; wait for the next refresh.
Where do EasyBear.ai's numbers come from, and how accurate are they?
- Options chain: per-strike open interest and greeks from the market's live option book, snapshotted every 15 minutes.
- The chain snapshot delivers per-strike greeks for some strikes; the remainder are priced with a Black-Scholes fallback (modeled, not live).
- The sign convention (dealers long calls, short puts) is the industry standard, stated plainly on the footer.
- Trade-side attribution (whale / sweep / institutional) is refused; the feed cannot support it.
Three categories of number live on the dashboard: measured, modeled, and not-knowable. Measured numbers come directly from the options chain snapshot: strike, expiry, open interest, spot, timestamp. Modeled numbers come from a well-defined formula applied to the measured inputs: net dealer gamma per strike, delta exposure, the continuous-solver flip level, and the Black-Scholes fallback pricing for the strikes without live per-strike greeks. The footer's GREEKS · % LIVE flag names the percentage that is measured versus modeled.
Not-knowable numbers are refused. Trade-side attribution (who crossed the spread, whether a print was a buy or a sell, "whale" or "institutional" labels) requires last-trade tape with aggressor flags that the feed does not carry at a usable price. Rather than dress those inferences up as fact, EasyBear.ai names them as not-knowable on the footer TRANSPARENCY row.
When a ticker's snapshot is missing per-strike delta, the DEX metric is disabled with the tooltip "delta exposure unavailable in this data snapshot". The number does not fall back to zero, and the toggle is not left enabled with silent nulls. Wait for the next refresh.
| Category | Examples | Where it shows |
|---|---|---|
| Measured | Strike, expiry, open interest, spot, timestamp | All panels; SRC + COVERAGE footer flags |
| Modeled | Net dealer gamma / delta per strike; continuous flip; Black-Scholes fallback for strikes without live greeks | Combined view, curve, hero cards; GREEKS · % LIVE footer flag |
| Not-knowable | Trade-side attribution (whale / sweep / institutional) | Refused; named on the footer |
Glossary A–Z
Every term the tutorial and dashboard use, in one place. Alphabetical.
- 0DTE
- Zero days-to-expiry. Options that expire today. The 0DTE view narrows every panel to this same-day book.
- Amplifying
- Regime behavior where dealer hedging pushes price further in the direction it's already moving. Present under short-gamma / negative-GEX conditions. See A4, B2.
- Book Anchor
- The heaviest strike at the next monthly OPEX expiry. The month's magnet, even when far from spot. Rendered as a bare BOOK ANCHOR chip with no glyph, on purpose. See C5.
- Call wall
- The strike above spot with the heaviest positive dealer gamma. Dealers there must sell into rallies approaching the strike, which caps price. See C1.
- Call-tilted / Put-tilted (DEX)
- The direction the DEX book leans. Call-tilted overhead means dealers hedge long; put-tilted below means dealers hedge short. See A3, B5.
- Coverage
- Footer flag naming how many contracts and expiries feed the current snapshot. See F8.
- Dampening
- Regime behavior where dealer hedging pulls price back toward its recent range. Present under long-gamma / positive-GEX conditions. See A4, B2.
- Dealer / Market maker
- The counterparty on the other side of every options trade whose job is quoting bids and offers, not directional trading, and who therefore hedges every position that lands in inventory. See A2.
- Delta
- How much an option's price moves per $1 of underlying move. Also the number of shares the option acts like right now. See A0.
- Delta hedging
- Buying or selling the underlying to keep an options position directionally flat as price moves. See A2.
- Delta notional
- Delta expressed in dollars of underlying rather than share count. The unit DEX uses on the dashboard.
- DEX
- Delta exposure. The dollar amount of underlying dealers must currently hold to be flat, standing weight against the options they carry. See A3.
- DTE
- Days to expiry. Determines gamma sharpness at the ATM strike. See D6.
- Expiry
- The date an options contract settles. Every option belongs to one expiry.
- Fold band
- Collapsed row in the Combined view's Full-density mode, shown as [+ N] where N is the collapsed row count. See F4.
- Gamma
- The rate of change of delta per $1 move in the underlying. Peaks at ATM strikes near expiry. See A0, A1, D6.
- Gamma flip
- The price level where net dealer gamma changes sign. Above it dealers dampen; below they amplify. See C3.
- Gamma pinning
- Mechanical drift toward the strike carrying the most dealer gamma as expiry approaches. See D2.
- Gamma squeeze
- Short-gamma amplification: rising price forces dealer buying, which pushes price further, which forces more buying. See B2.
- GEX
- Gamma exposure. The dollar amount dealers must trade per 1% move in the underlying. See A1.
- GEX peak (★)
- Glyph naming the strike with the heaviest gamma in the visible book, wall or not. See C4.
- DEX peak (◇)
- Glyph naming the strike with the heaviest standing delta weight. See C4, B5.
- Gross vs Net
- Net GEX is positive minus negative pockets in the book. Gross GEX is their absolute sum. Low net-to-gross ratio signals offsetting. See B1, B3.
- Hedging flow
- The buying and selling of the underlying that dealers do to stay flat against options in inventory. See A2.
- Key Levels / Expanded / Full
- Three density modes on the Combined view. Key Levels shows walls, shelves, peaks, spot. Expanded adds strikes within one wall-band of spot. Full shows every strike with fold bands. See F4.
- Long gamma / Short gamma
- A regime label. Long gamma dampens moves; short gamma amplifies them. See A1, A4, B2.
- Multi-Day
- Time-scope toggle that aggregates the next ten expiries. Contrast with 0DTE. See D4.
- Near wall vs global wall
- The near wall is the heaviest positive or negative strike close to spot in the visible band. The global wall is the heaviest anywhere below spot (put wall) or above spot (call wall), which can be far. See C1, C2.
- Net GEX
- Net dealer gamma exposure. Positive plus negative pockets summed to a single dollar figure. See B1.
- Notional
- Dollar amount of underlying that an options position represents, computed from delta or from contract count and multiplier. Distinct from premium.
- Offsetting
- Regime state where positive and negative gamma pockets largely cancel. Named on the regime card. See B3.
- Open interest
- Total number of options contracts outstanding at a strike + expiry. The gross count that feeds every per-strike calculation.
- OPEX
- Options expiration. Weekly on Fridays; monthly on the third Friday; quarterly in March, June, September, December. See D1.
- Pinning
- See Gamma pinning.
- Points
- The underlying's price units. SPX in index points; SPY and QQQ in dollars. Distance-to-flip is always in the underlying's own units.
- Put wall
- The strike below spot with the heaviest negative dealer gamma. Selloffs often accelerate into it, then react hard. See C2.
- Regime
- Named state of the book: Long Gamma, Short Gamma, Long or Short Gamma Offsetting, Neutral, or Regime Transition. See B3.
- Regime pivot
- Row in the Combined view at the flip level that names the transition point. On narrow phone screens it wraps to three lines by design. See F3.
- Regime Transition
- Amber state that names the case when spot sits within a small distance of the flip. The book is undecided. See C3.
- Shelf (△/▽)
- Secondary gamma strike between the walls. Enough gamma to slow a move, not enough to stop it. See C4.
- Short gamma
- See Long gamma / Short gamma.
- Spot
- The current price of the underlying, 15-min delayed on the dashboard. See F1.
- Strike
- The specific price an options contract is written at. Every row in the Combined view is one strike.
- Strong / Moderate (benchmark rule)
- DEALER BEHAVIOR label rule. Bars past roughly two-thirds of column-max read Strong; between one-third and two-thirds read Moderate; below that the row goes silent. See F3.
- YOU ARE HERE
- Divider in the Combined view that separates strikes overhead of spot from strikes below. See F3.
- Zero-gamma level
- See Gamma flip.
FAQ
Short, committed answers to the questions people search most.
What is GEX in trading?
Gamma exposure is the dollar amount of stock or futures that dealers must trade to stay hedged when the underlying moves 1%. It is a running dollar figure. Positive GEX means dealers sell rallies and buy dips, which compresses moves. Negative GEX means they trade with the move, which amplifies it.
Is high GEX bullish or bearish?
Neither on its own. High positive GEX means the day chops and drifts. High negative GEX means moves trend and gap. The sign tells you the regime; the level tells you the lean when combined with distance to flip.
What is a gamma squeeze?
A gamma squeeze is short-gamma amplification. When dealer positioning is short gamma, a sharp move up forces them to buy more, which pushes price higher, which forces more buying. It is not a magic event. It is one regime's mechanics doing exactly what the regime is defined to do.
What is the gamma flip level?
The gamma flip is the price level where net dealer gamma changes sign. Above it, dealers dampen moves. Below it, they amplify them. Crossing it mid-session changes the day's character.
What is a call wall and put wall?
The call wall is the strike with the heaviest positive gamma near spot. Dealers there must sell into rallies approaching it, which caps price. The put wall is the mirror below, with heavy negative gamma. Selloffs often accelerate into it, then react.
Why does the market pin on OPEX?
Gamma pinning is a mechanical drift toward the strike carrying the most dealer gamma as expiry approaches. Positive dealer gamma at a heavy strike forces market makers to sell rallies away from it and buy dips back toward it, which tightens price around that strike into the close. The effect is strongest when a single strike holds a large share of the day's open interest and the book is net long gamma there.
What is 0DTE gamma?
0DTE gamma is the dealer gamma exposure from options expiring the same day. Because gamma is largest right before expiry, 0DTE strikes carry the sharpest hedging response per point of price movement, which is why intraday levels move faster on the 0DTE view than on the multi-day view. The book also reprices continuously through the session as new 0DTE contracts trade.
What is DEX in options?
DEX (delta exposure) is the dollar amount of stock that dealers must currently hold to be flat, standing weight against options in inventory. GEX is what they have to trade if price moves 1%. GEX is the regime, DEX is the lean.
Do gamma levels work as support and resistance?
They mark strikes where dealer hedging flow concentrates, and hedging flow near a heavy strike often looks like support or resistance from the outside. They hold when the regime and open interest at the strike stay stable through the test, and they fail when the regime flips, the strike rolls off after expiry, or a real news catalyst overrides flow. The dashboard maps the mechanism honestly instead of calling them support and resistance, because the S/R label promises causation the mechanism does not carry.
How often does EasyBear.ai update?
The dashboard refreshes every 15 minutes during US options market hours. When the market is closed the panel shows the last session's close snapshot with a market-closed notice in the topbar. All numbers on every card, table, and chart share the same 15-minute refresh cycle.
Why does EasyBear.ai sometimes say "no GEX data" for a ticker?
When a ticker's chain-source snapshot fails to return per-strike open interest and greeks, the panel shows "No GEX data available for {T} right now" instead of stale numbers or blank cards. The message is explicit and honest; wait for the next 15-minute refresh. A related state, "delta exposure unavailable in this data snapshot", disables the DEX metric when per-strike delta is missing but the rest of the book is present.